Reports: How to create a custom report?
In this tutorial, you'll discover how to create a custom report on Craze, a powerful feature that enables organizations to analyze and visualize data effectively. By leveraging this functionality, you can uncover insights, identify trends, and make data-driven decisions. For this example, we'll focus on measuring and visualizing pay differences between genders for roles with the same title.
We will be creating something that looks like this

Navigate to the Reports tab.
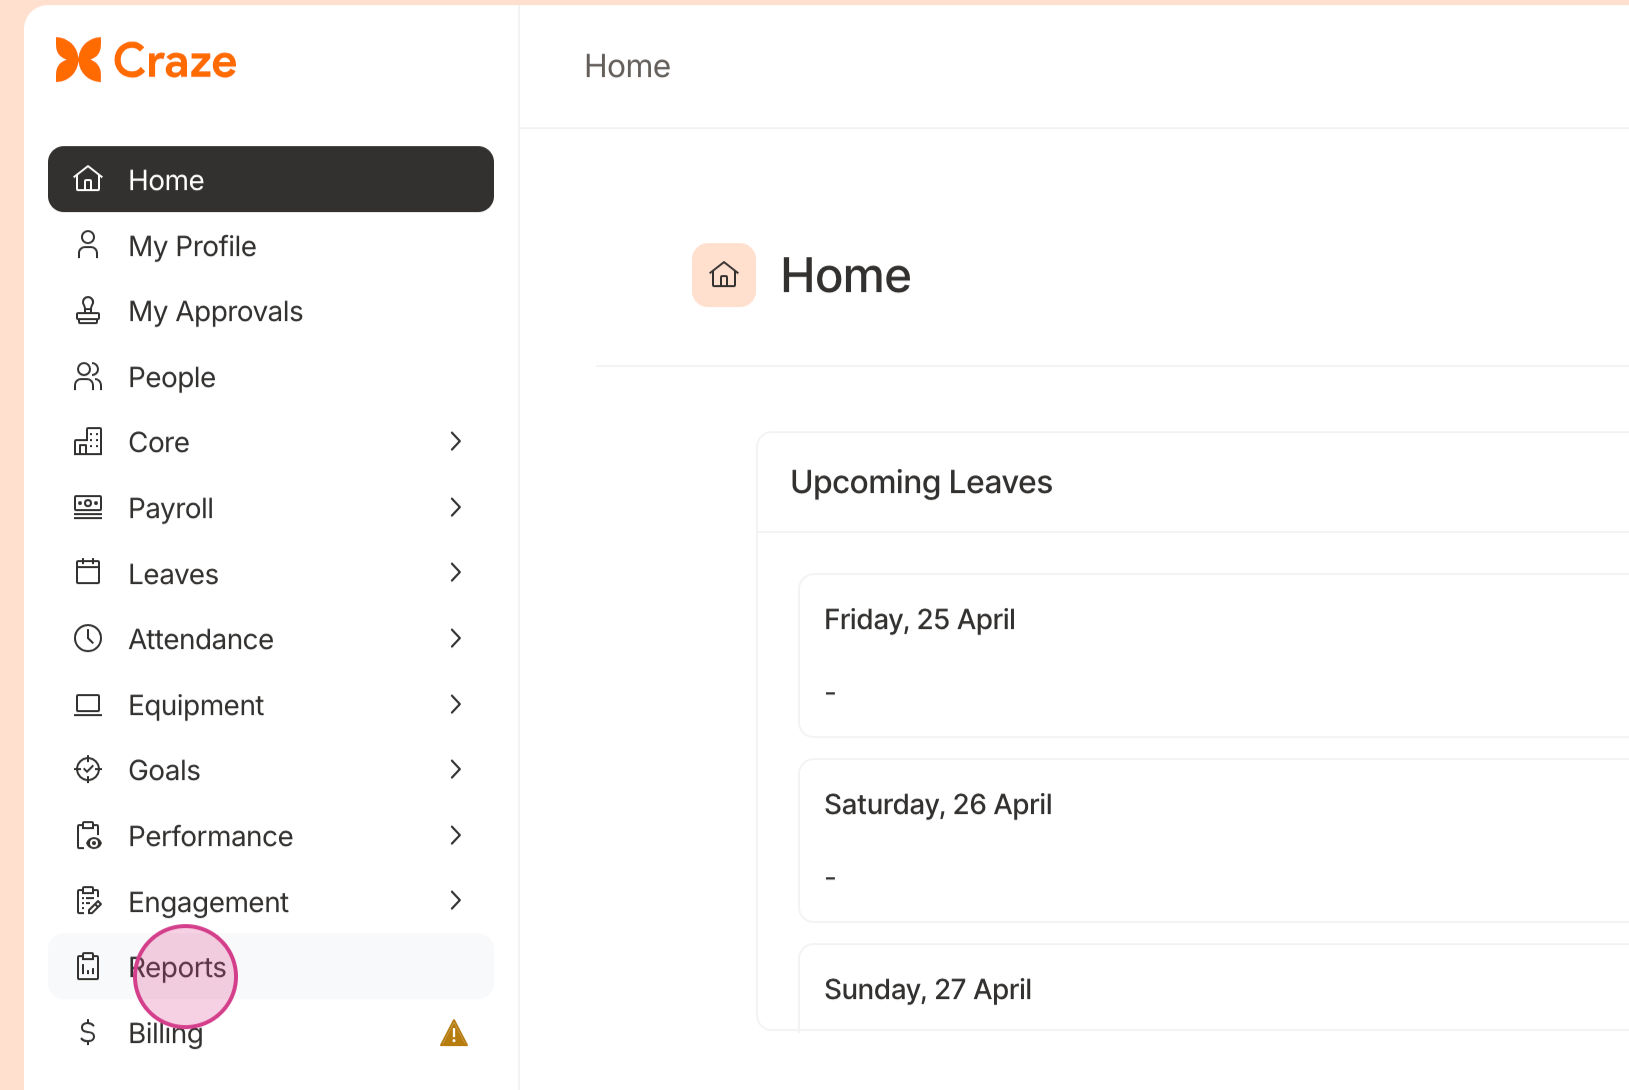
Click on Create Report.
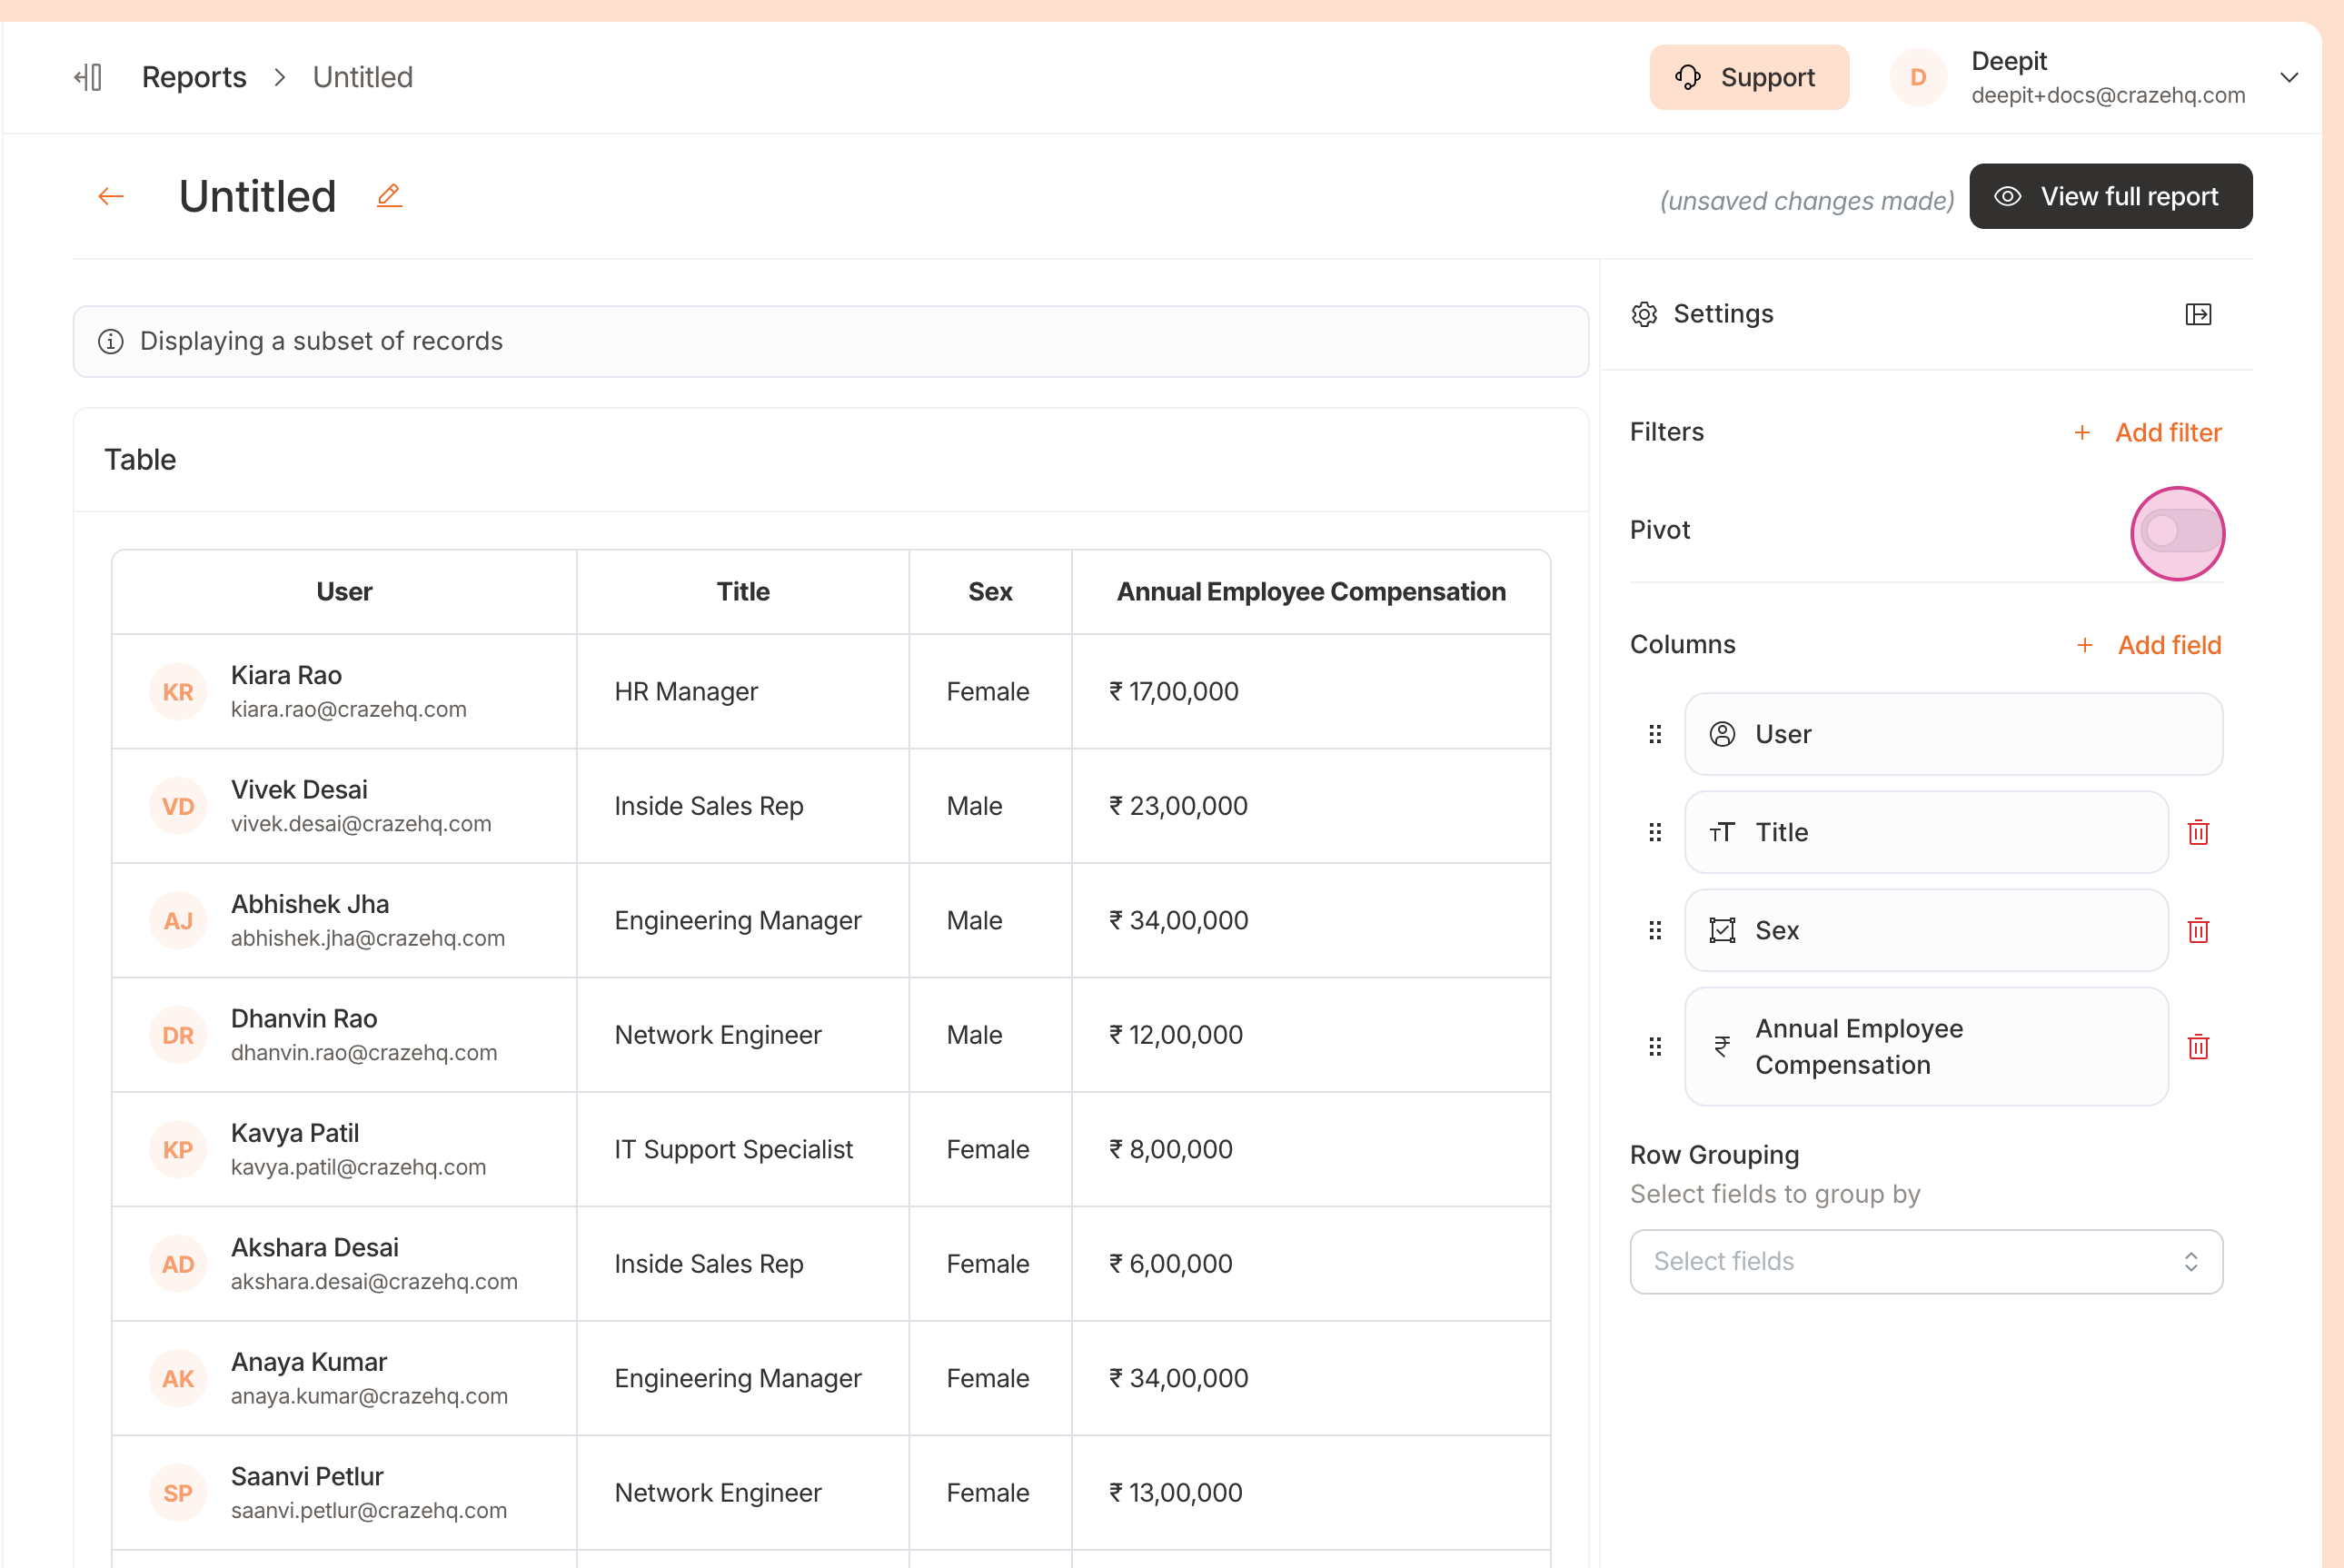
Begin by adding relevant fields to your report. Craze lets you choose fields from all your apps to create reports. For this example, we will need Title from role details, Sex from personal details, and Annual Employee Compensation from compensation details.
Now, you'll see a table displaying the fields you've selected for your organization's employees. To group the data and compute aggregate values, convert this into a pivot table by clicking on the pivot switch.
Now, you can choose how you want to group and aggregate your data. For this example, we want to get the Average Annual Compensation for each Title for each Sex. Choose Title as the row headers and Sex as the column headers of your pivot table. Then aggregate the Annual Compensation field by taking the Average.
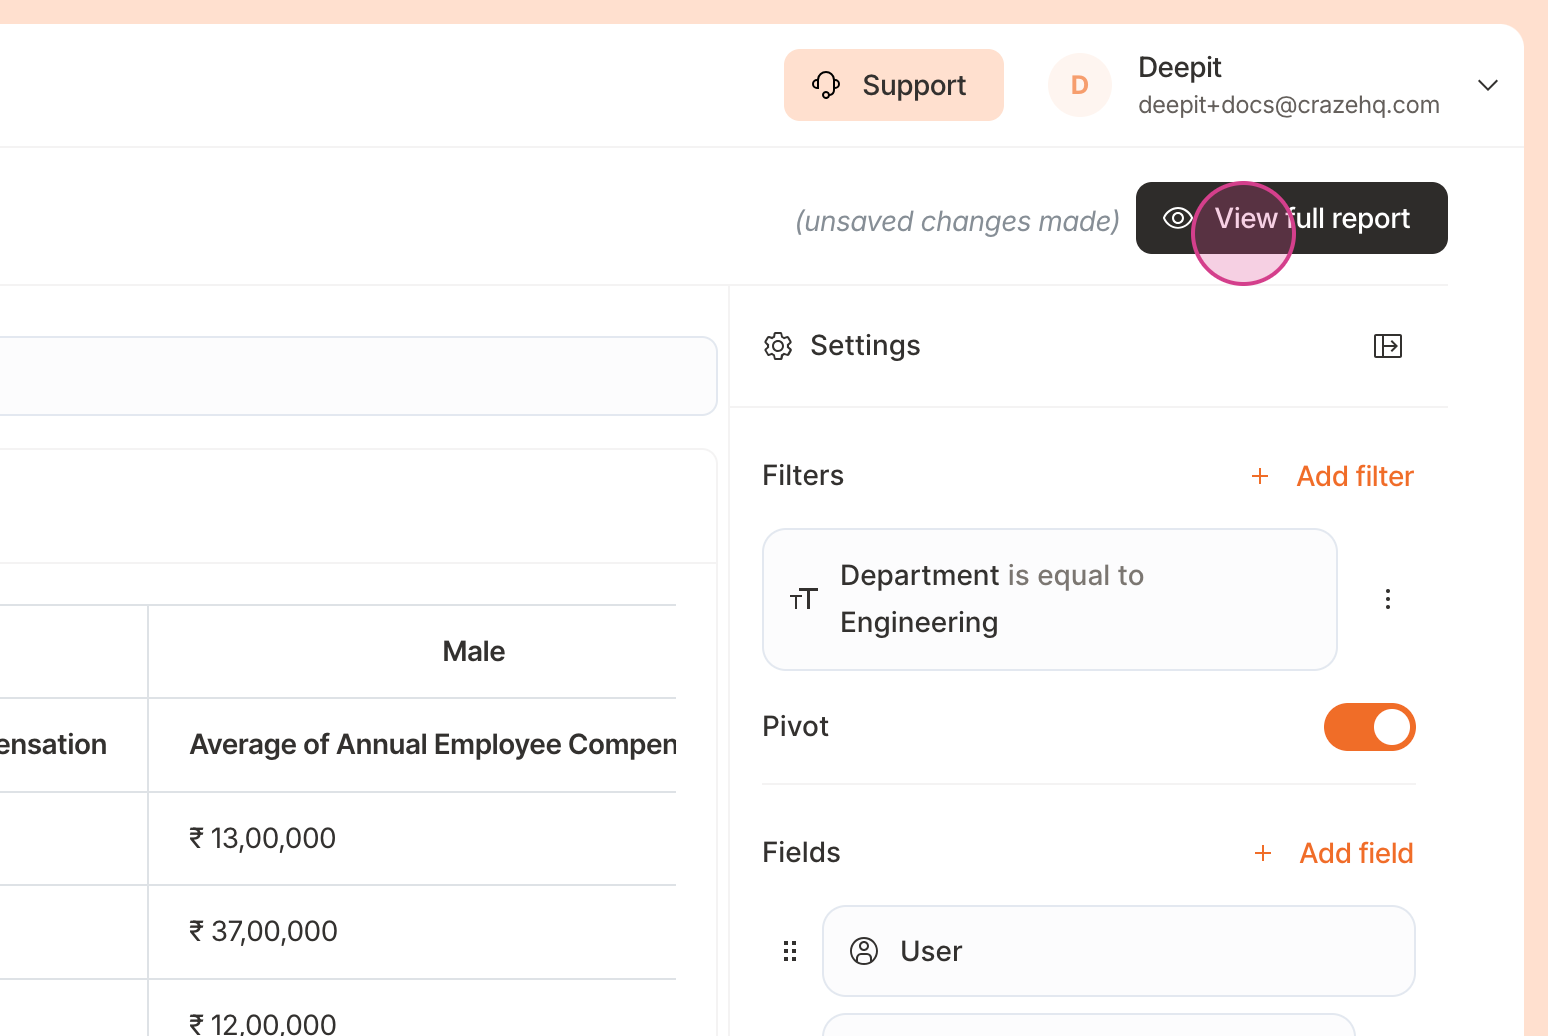
Let us also add a filter to view this report only for employees in the engineering department. Select Department is equal to Engineering.
Click on View Full Report to generate the entire report for all employees.
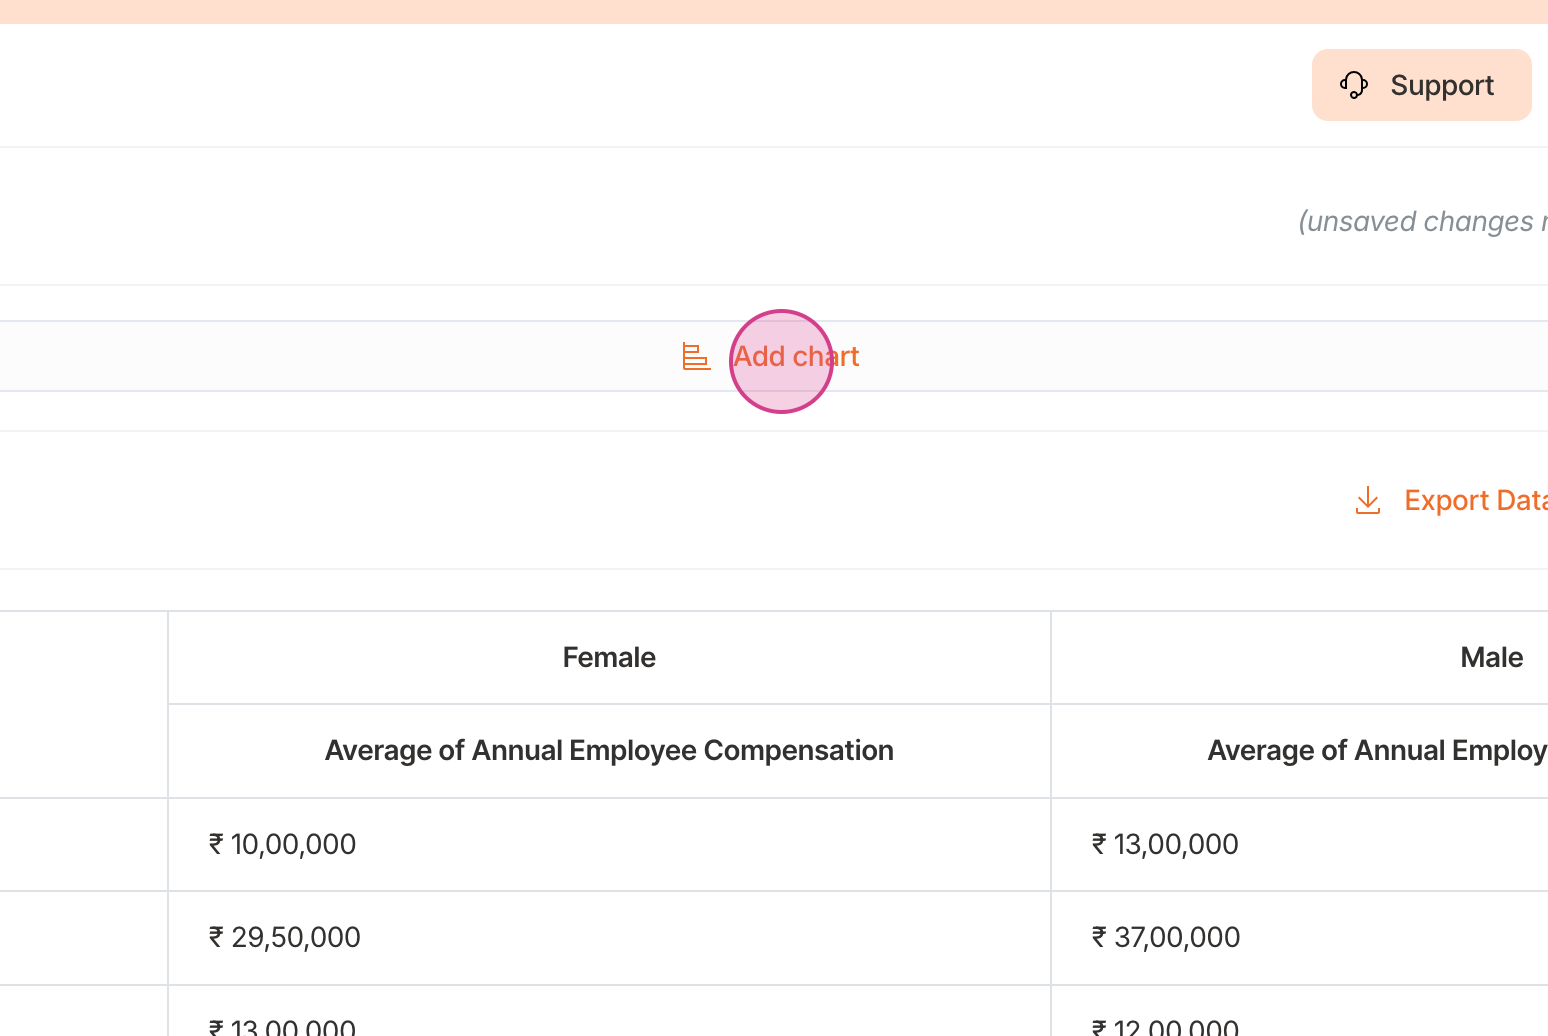
Visualize this data by clicking on Add Chart.
Craze automatically selects a chart that fits the information. Here, it's used a group bar graph to visualize the pay difference between different genders across different titles in the engineering department.
You can also click on Edit Chart to change the chart type. For this tutorial, we'll stick with a bar chart.
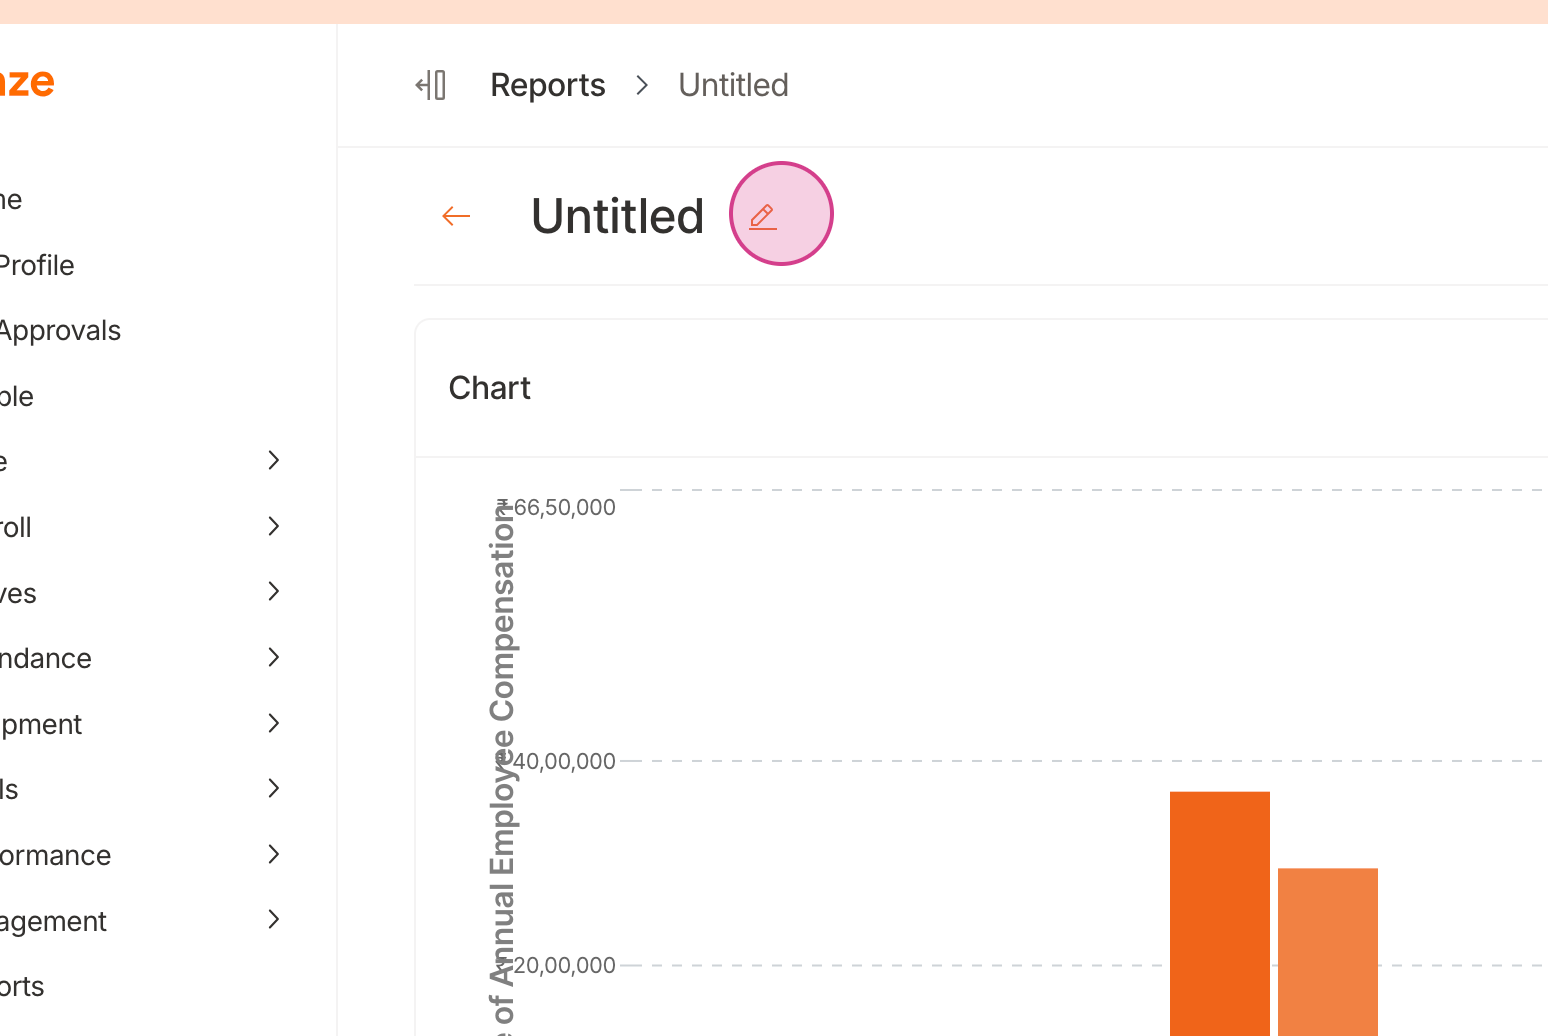
Don't forget to give your report a descriptive name.
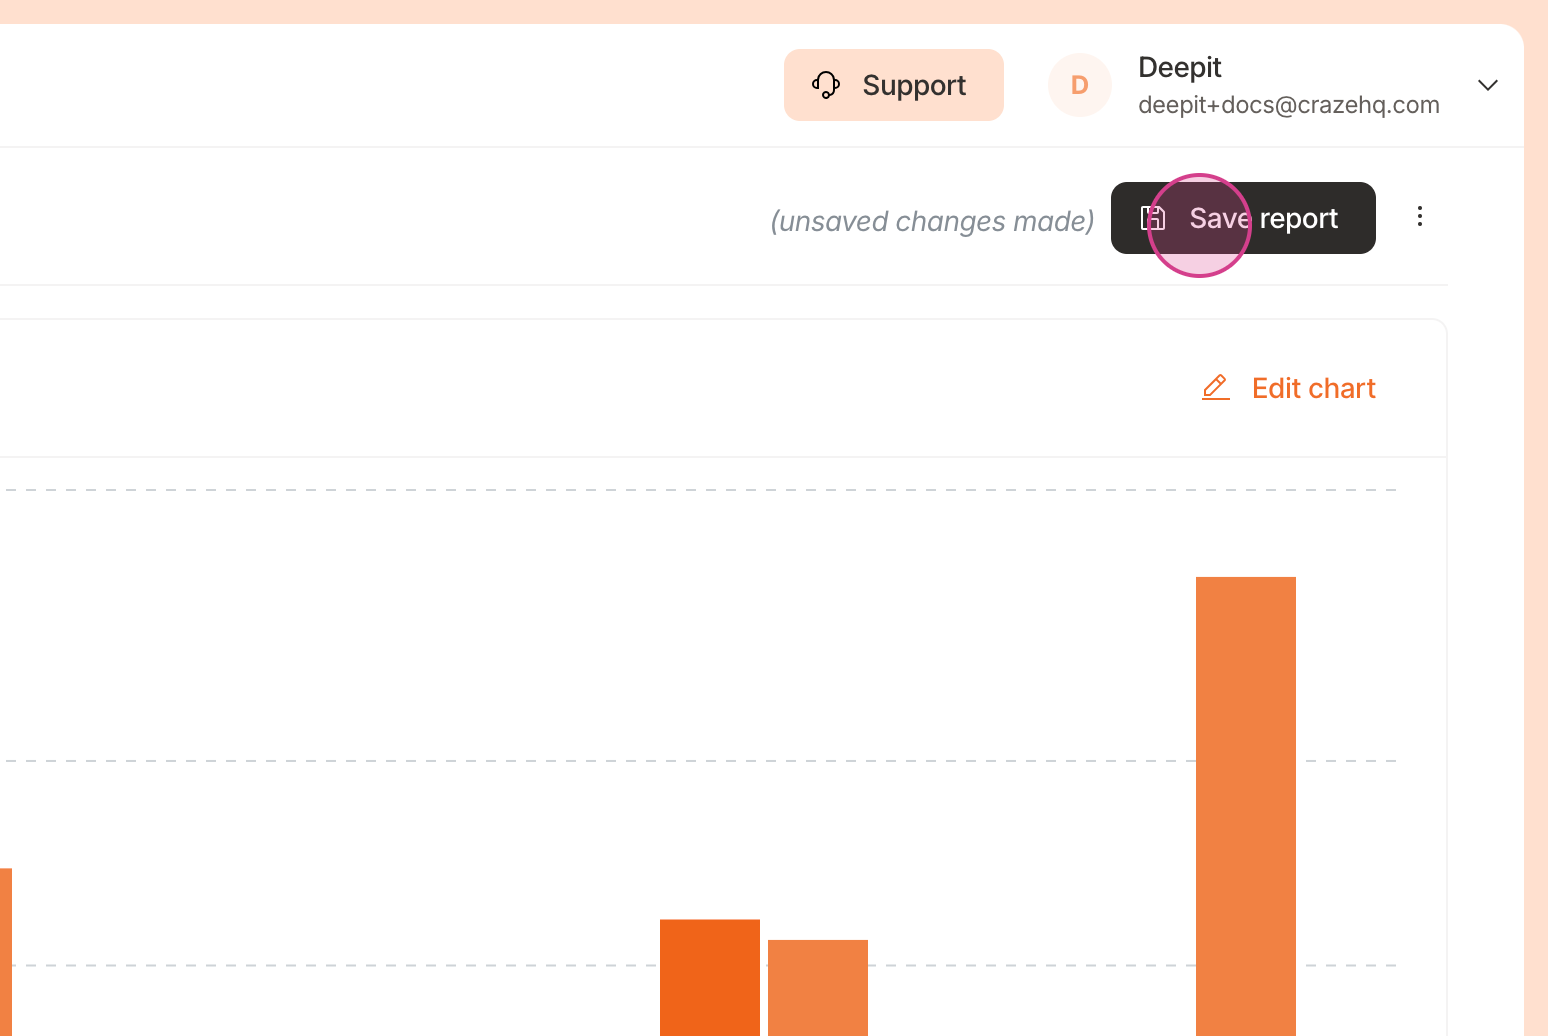
Save your report.
And that's it! Your report is now saved. Thank you for following this tutorial.
Updated on: 26/04/2025
Thank you!